Plot base peak chromatograms for multiple high resolution masses in multiple samples.
Source:R/plotBPC.R
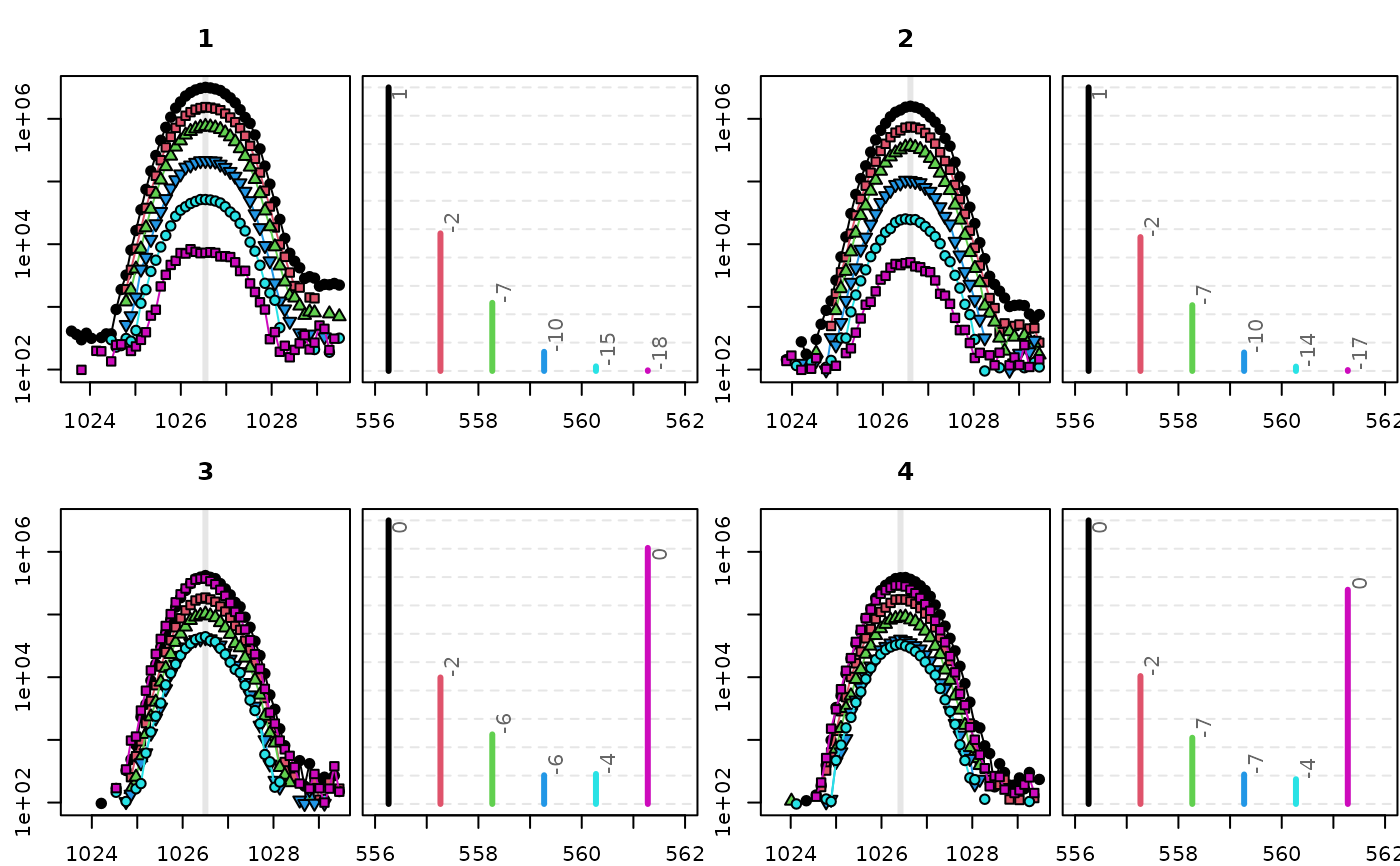
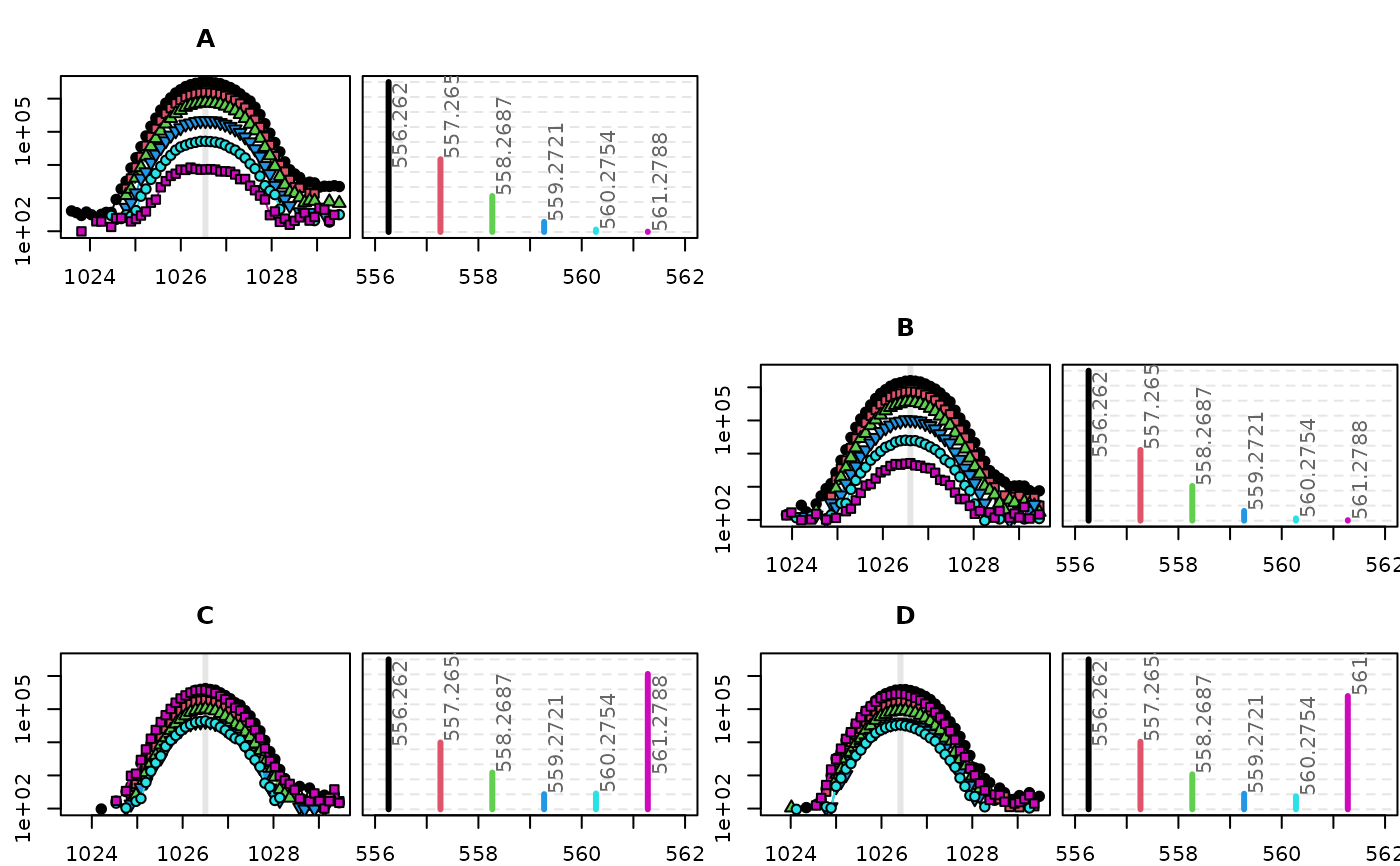
plotBPC.RdplotBPC will plot for each item of a list of result-objects
from getMultipleBPC the BPC traces and the spectrum at the scan
where the summed intensity of all ions is max.
Usage
plotBPC(
  bpc = NULL,
  mfrow = NULL,
  skip_plots = NULL,
  ylim = NULL,
  col = NULL,
  ids = NULL,
  type = "both",
  ann = c("mdev", "mz", "none")
)
Arguments
- bpc
A bpc object (list of intensity matrices, rt x mz, including several attributes as attached by getMultipleBPC).
- mfrow
Specify mfrow explicitly (is optimized internally if NULL to cover n=length(bpc)).
- skip_plots
Allows to block certain subplots in the mfrow matrix to better align replicates.
- ylim
Can be specified specifically, will be adjusted to overall min/max otherwise.
- col
Specific color vector for masses may be provided.
- ids
Specific plot ids may be explicitly provided.
- type
Switch between co-plot of BPC and Spectrum ("both") or BPC alone ("bpc").
- ann
Select value to annotate peaks in spectrum. Usually the mass deviation from the expected value in mDa.